The Best Grapplers: Animals with Top PC2 Values
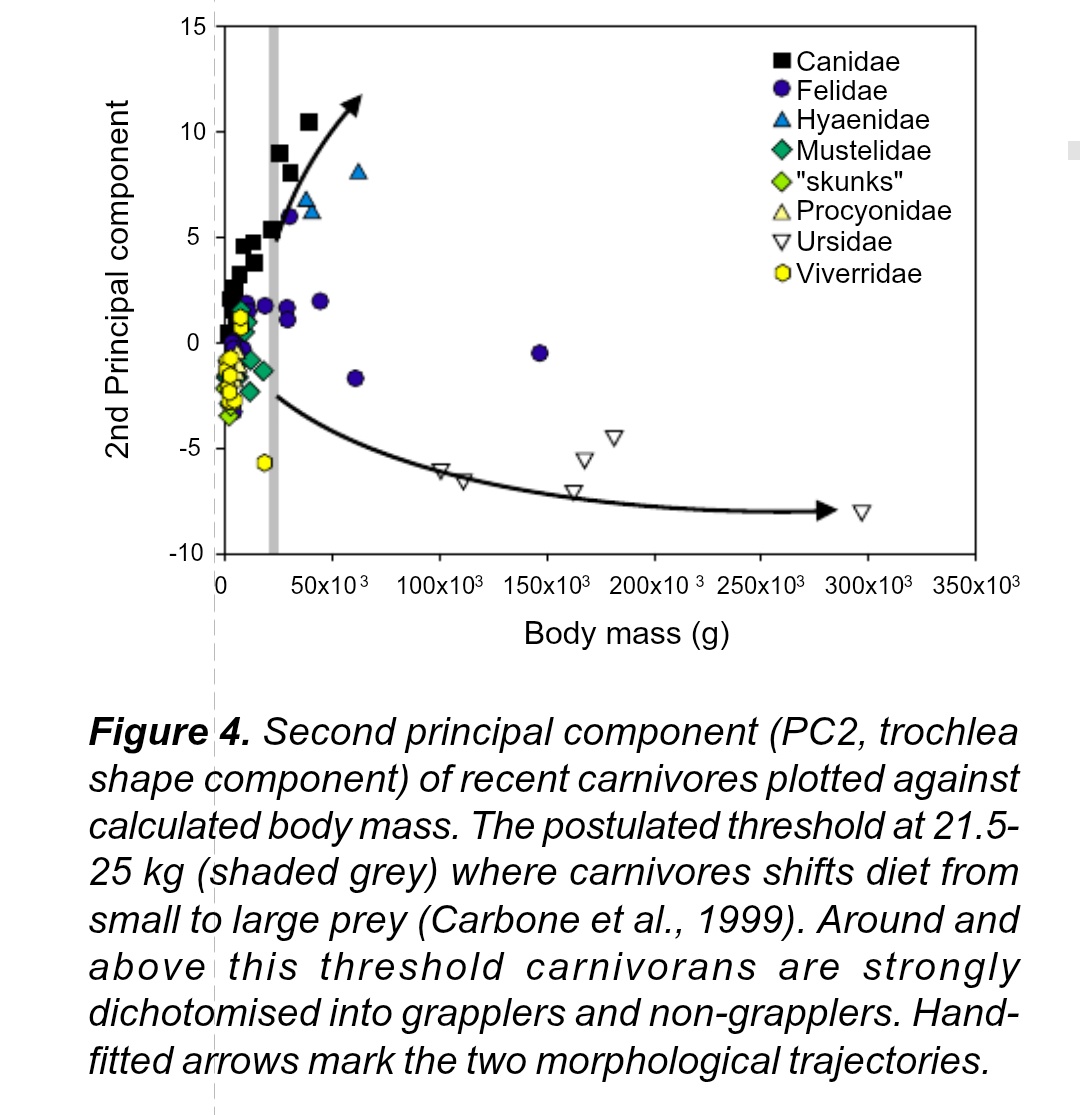
A scientific scatter plot titled 'Figure 4' shows carnivore species plotted by body mass (g) on the x-axis and second principal component (PC2) on the y-axis. Data points are color-coded and shaped by family (Canidae, Felidae, Hyaenidae, etc.), with a shaded grey vertical band indicating a 21.5-25 kg threshold. The caption explains this threshold marks a dietary shift from small to large prey and that carnivores above it split into 'grapplers' and 'non-grapplers', with arrows showing morphological trajectories. The image is a real scientific figure, not a meme.
0
0
0
0
2025-03-04 14:26:03
See More Related Memes

Loading...
Comments
No comments yet. Be the first to comment!