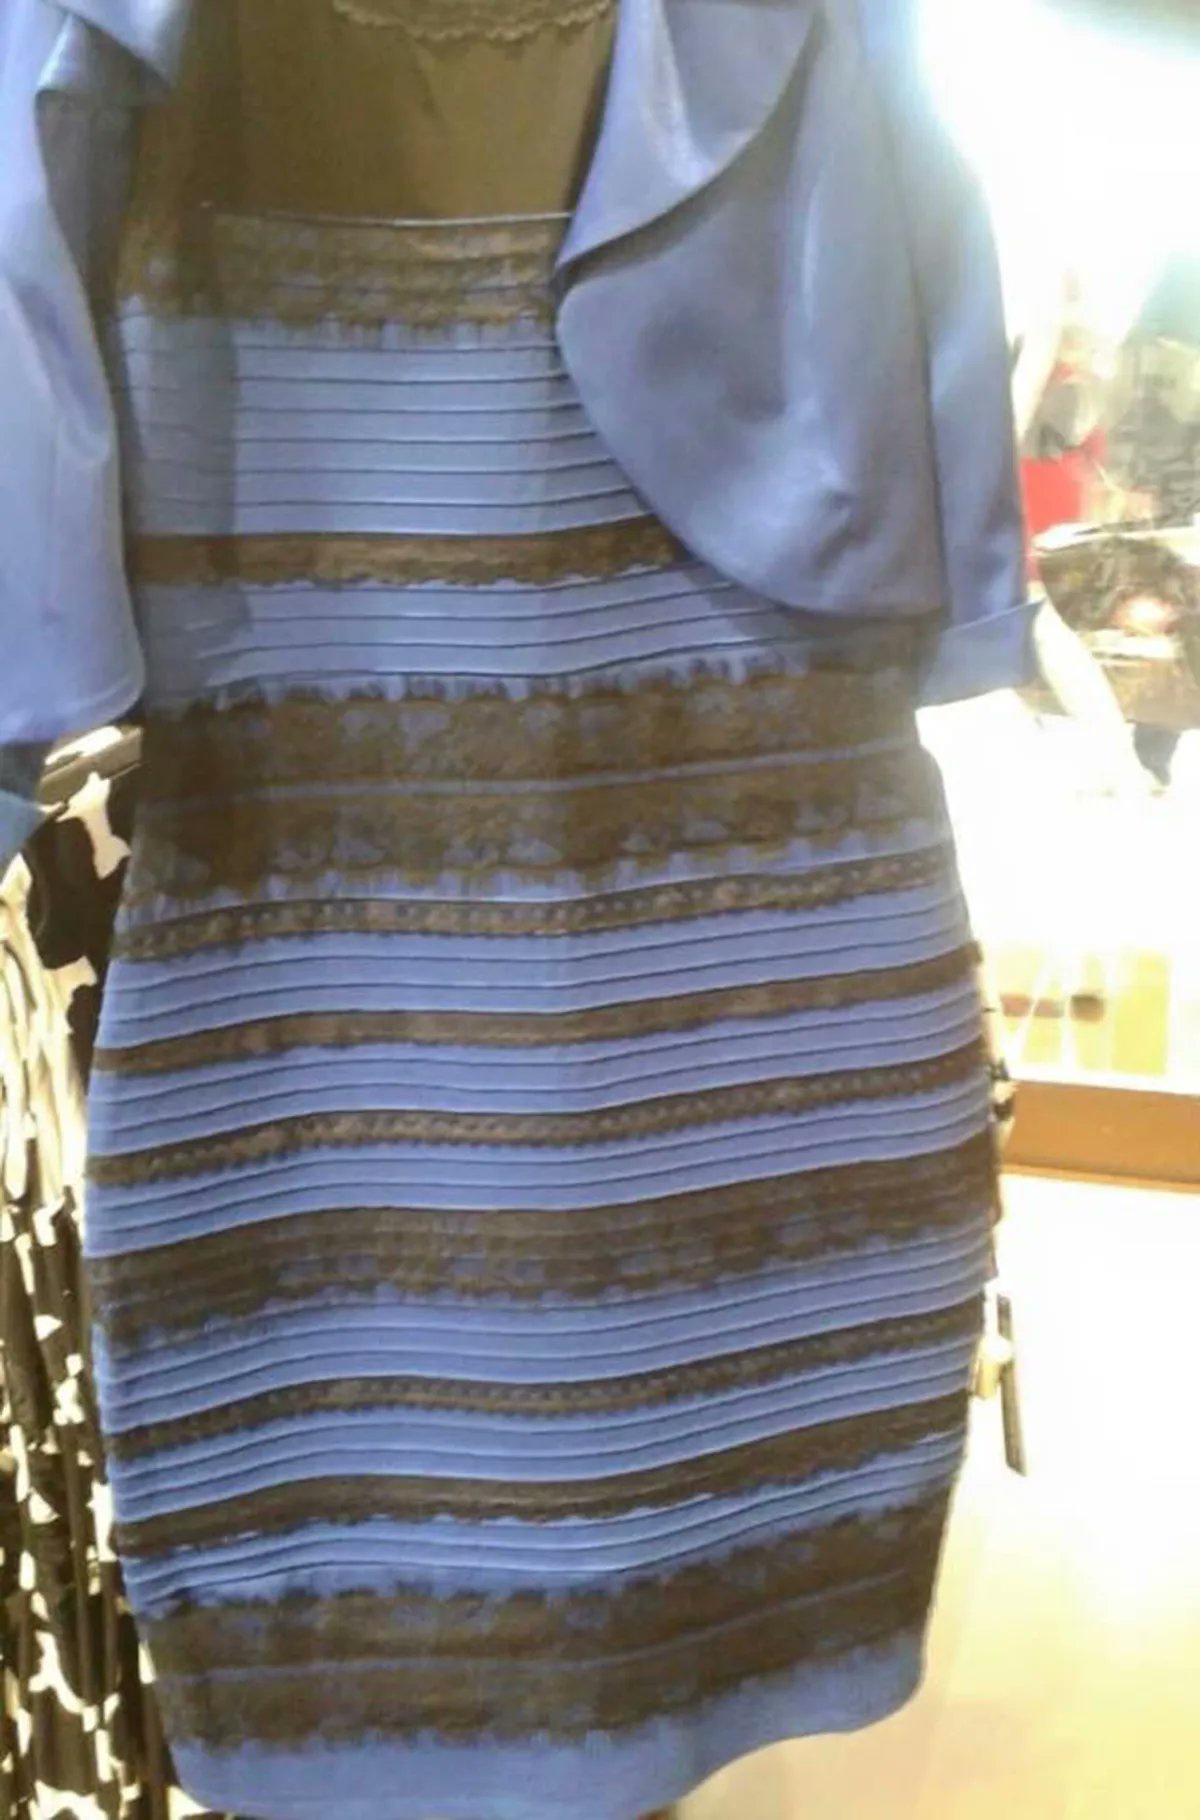
Happy New Year... with a Side of Coughing!
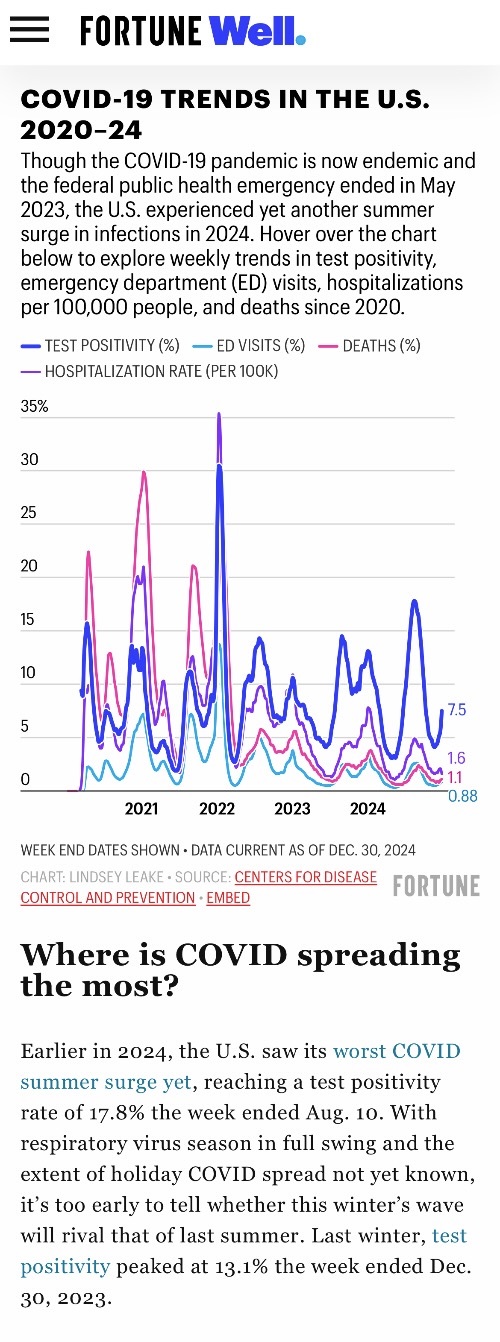
A Fortune Well article screenshot showing a line chart titled 'COVID-19 TRENDS IN THE U.S. 2020-24' with four colored lines representing test positivity, ED visits, deaths, and hospitalization rates over time. The chart displays peaks and troughs from 2020 to 2024, with data current as of Dec. 30, 2024. Below the chart, a section titled 'Where is COVID spreading the most?' discusses the worst summer surge in 2024, noting a test positivity rate of 17.8% and comparing it to the 13.1% peak from the previous winter.
0
0
0
0
2025-04-17 23:20:05
See More Related Memes

Loading...
Comments
No comments yet. Be the first to comment!