Examining the challenges facing the Democratic Party in US elections
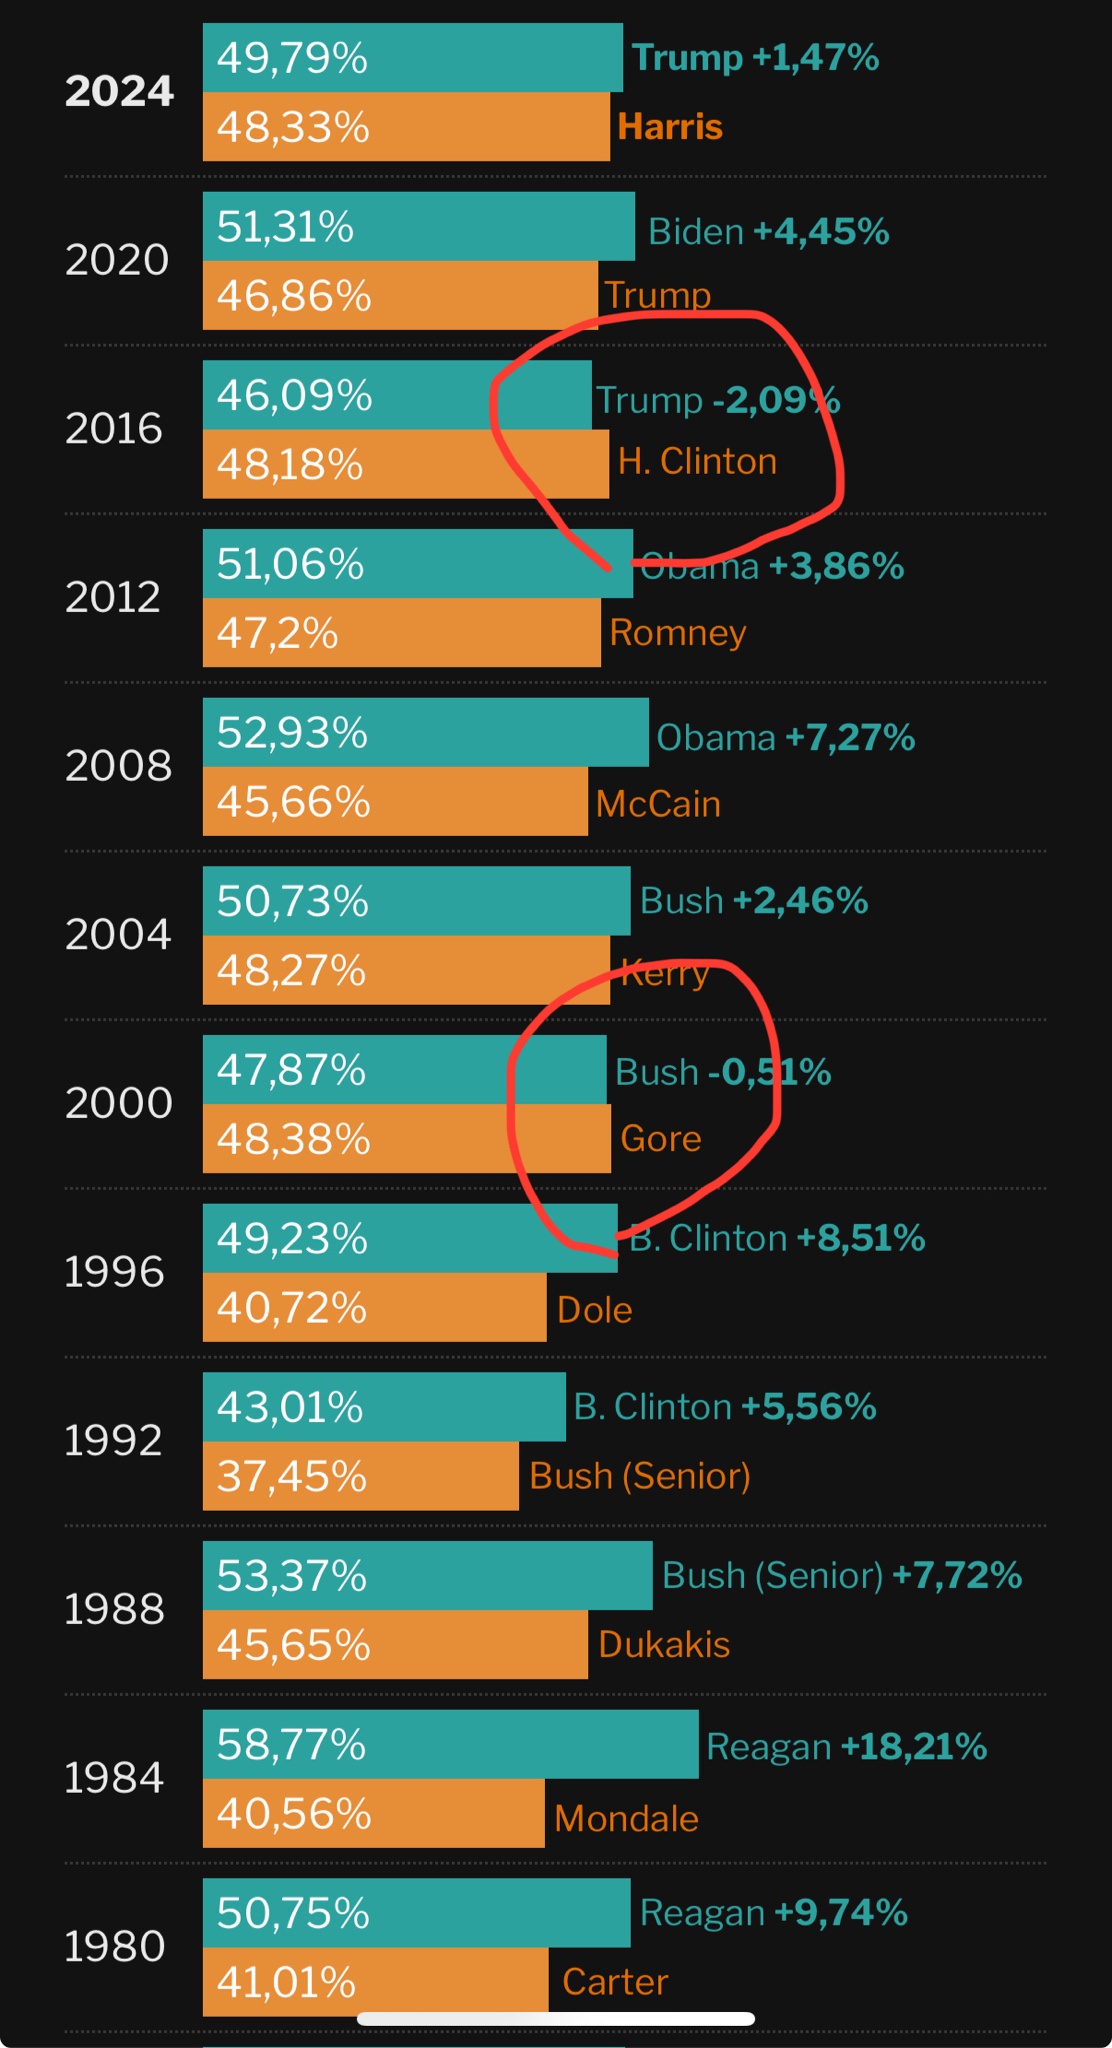
A vertical bar chart showing U.S. presidential election results from 1980 to 2024, with each election year having two bars for the winning and losing candidates' percentages. The 2016 election row, showing Trump at 46.09% and H. Clinton at 48.18%, is circled in red, with text indicating Trump's vote share decreased by 2.09% compared to the previous election. The 2000 election row, showing Bush at 47.87% and Gore at 48.38%, is also circled in red, with text indicating Bush's vote share decreased by 0.51% compared to the previous election. The chart displays the percentage change for the winning candidate compared to the previous election.
0
0
0
0
2025-04-14 05:50:02
See More Related Memes

Loading...
Comments
No comments yet. Be the first to comment!