Weekly Weather Insights: Rio Rancho, NM from November 4 to November 10, 2024
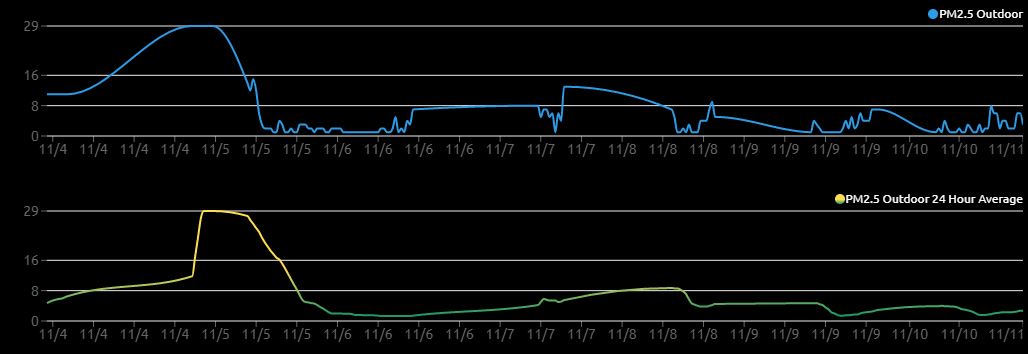
A line graph showing PM2.5 outdoor air quality levels over time, with a blue line for instantaneous readings and a yellow line for 24-hour averages, both trending downward after a spike on 11/5. The graph displays data from 11/4 to 11/11 with y-axis values from 0 to 29 and x-axis dates. The overlaid text labels the two lines as 'PM2.5 Outdoor' and 'PM2.5 Outdoor 24 Hour Average'.
0
0
0
0
2025-04-11 08:40:03
See More Related Memes
Loading...
Comments
No comments yet. Be the first to comment!