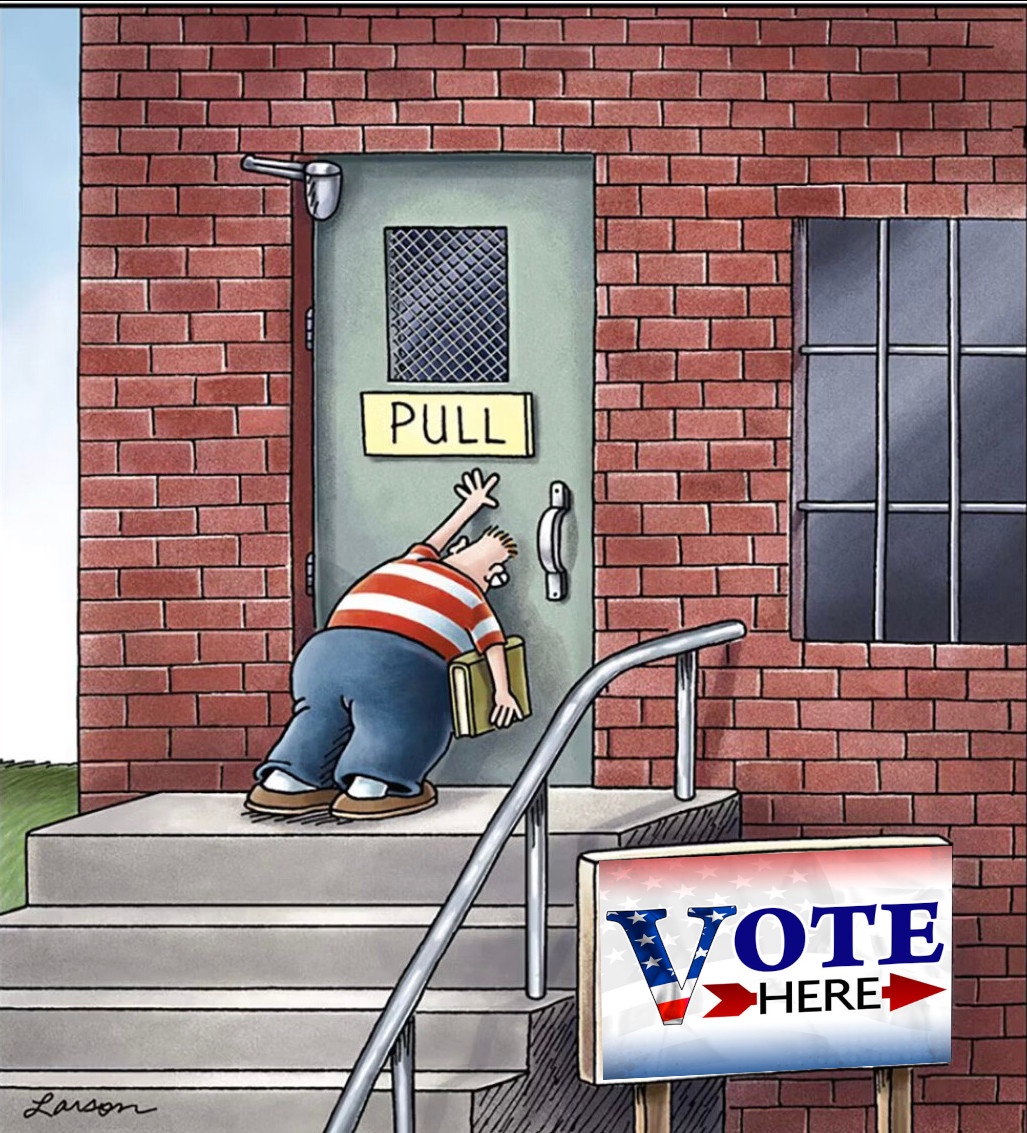
The Popular Vote in the US Presidential Election Explained
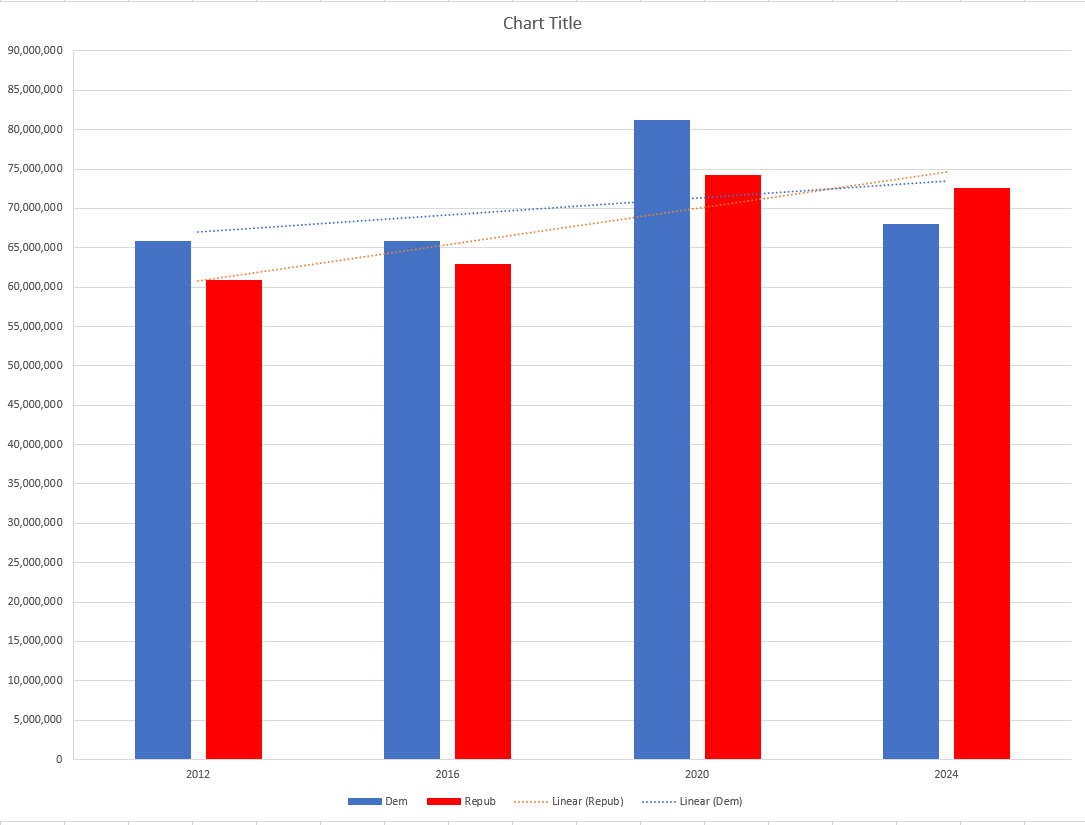
A bar chart with blue and red bars for years 2012, 2016, 2020, and 2024, showing 'Dem' and 'Repub' values, with dotted trend lines labeled 'Linear (Repub)' and 'Linear (Dem)' crossing near the 2020 data point. The y-axis ranges from 0 to 90,000,000, and the x-axis shows the years. The chart title is 'Chart Title'.
0
0
0
0
2025-04-11 13:10:02
See More Related Memes

Loading...
Comments
No comments yet. Be the first to comment!