When science textbooks reveal their secrets in the most unexpected ways
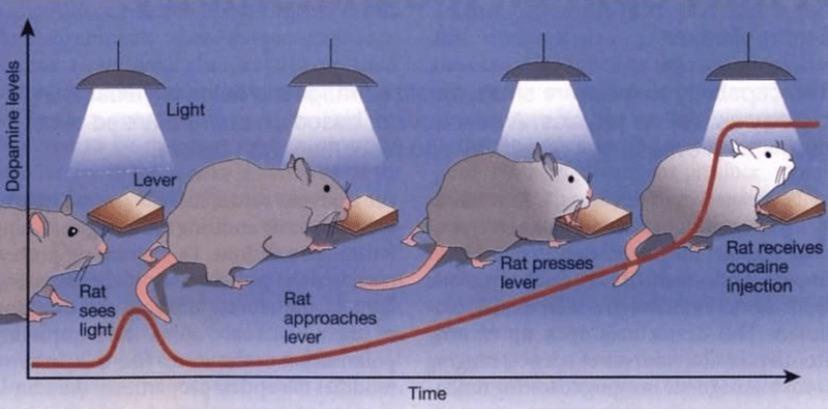
A scientific diagram shows a rat in a lab undergoing a behavioral experiment over time. The x-axis is labeled 'Time' and the y-axis is labeled 'Dopamine levels'. Four sequential panels depict the rat's actions: first seeing a light, then approaching a lever, then pressing the lever, and finally receiving a cocaine injection. A red line graph tracks dopamine levels, showing a small initial spike when the rat sees the light, a larger spike when it approaches the lever, and an enormous spike when it receives the cocaine injection. The diagram is labeled with text describing each stage of the rat's behavior.
0
0
0
0
2025-03-04 21:20:27
See More Related Memes

Loading...
Comments
No comments yet. Be the first to comment!