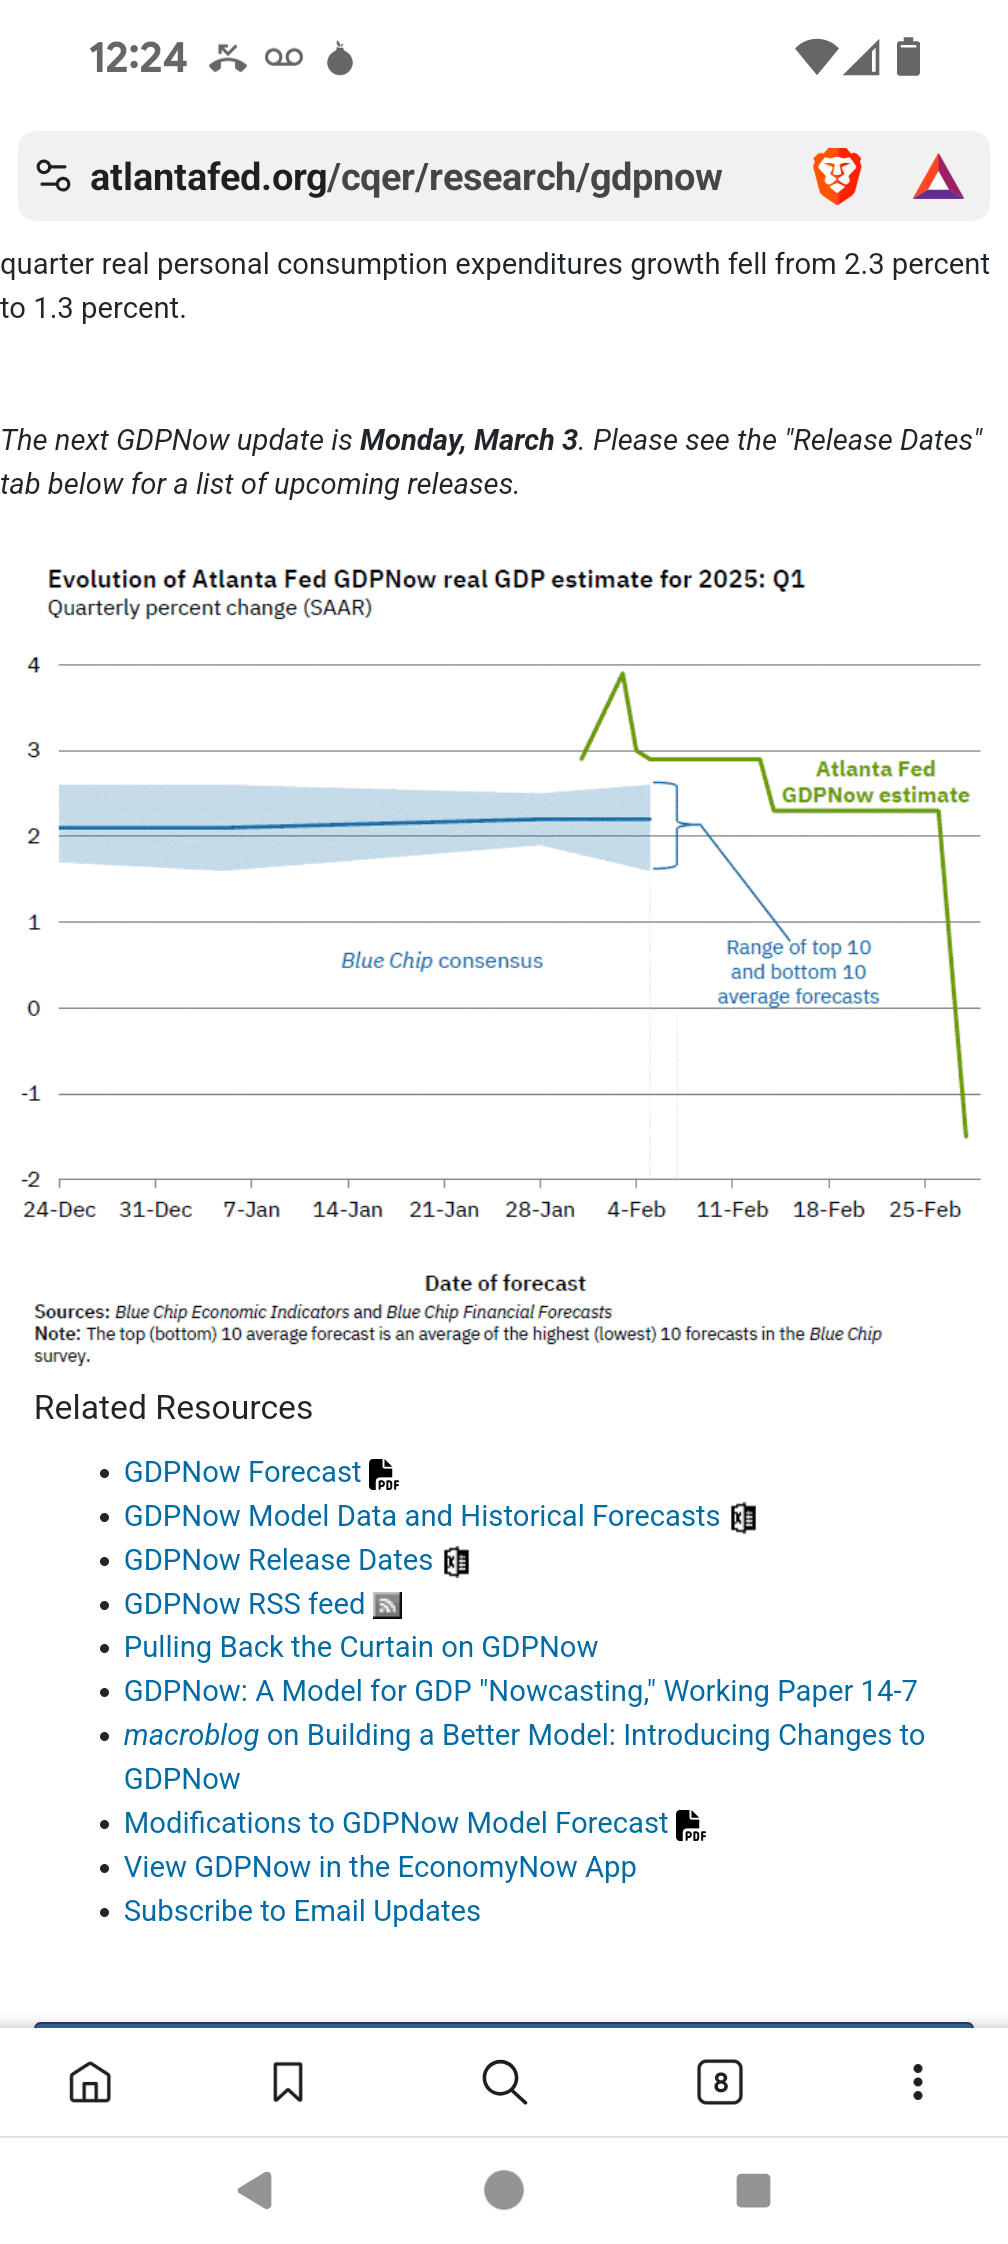
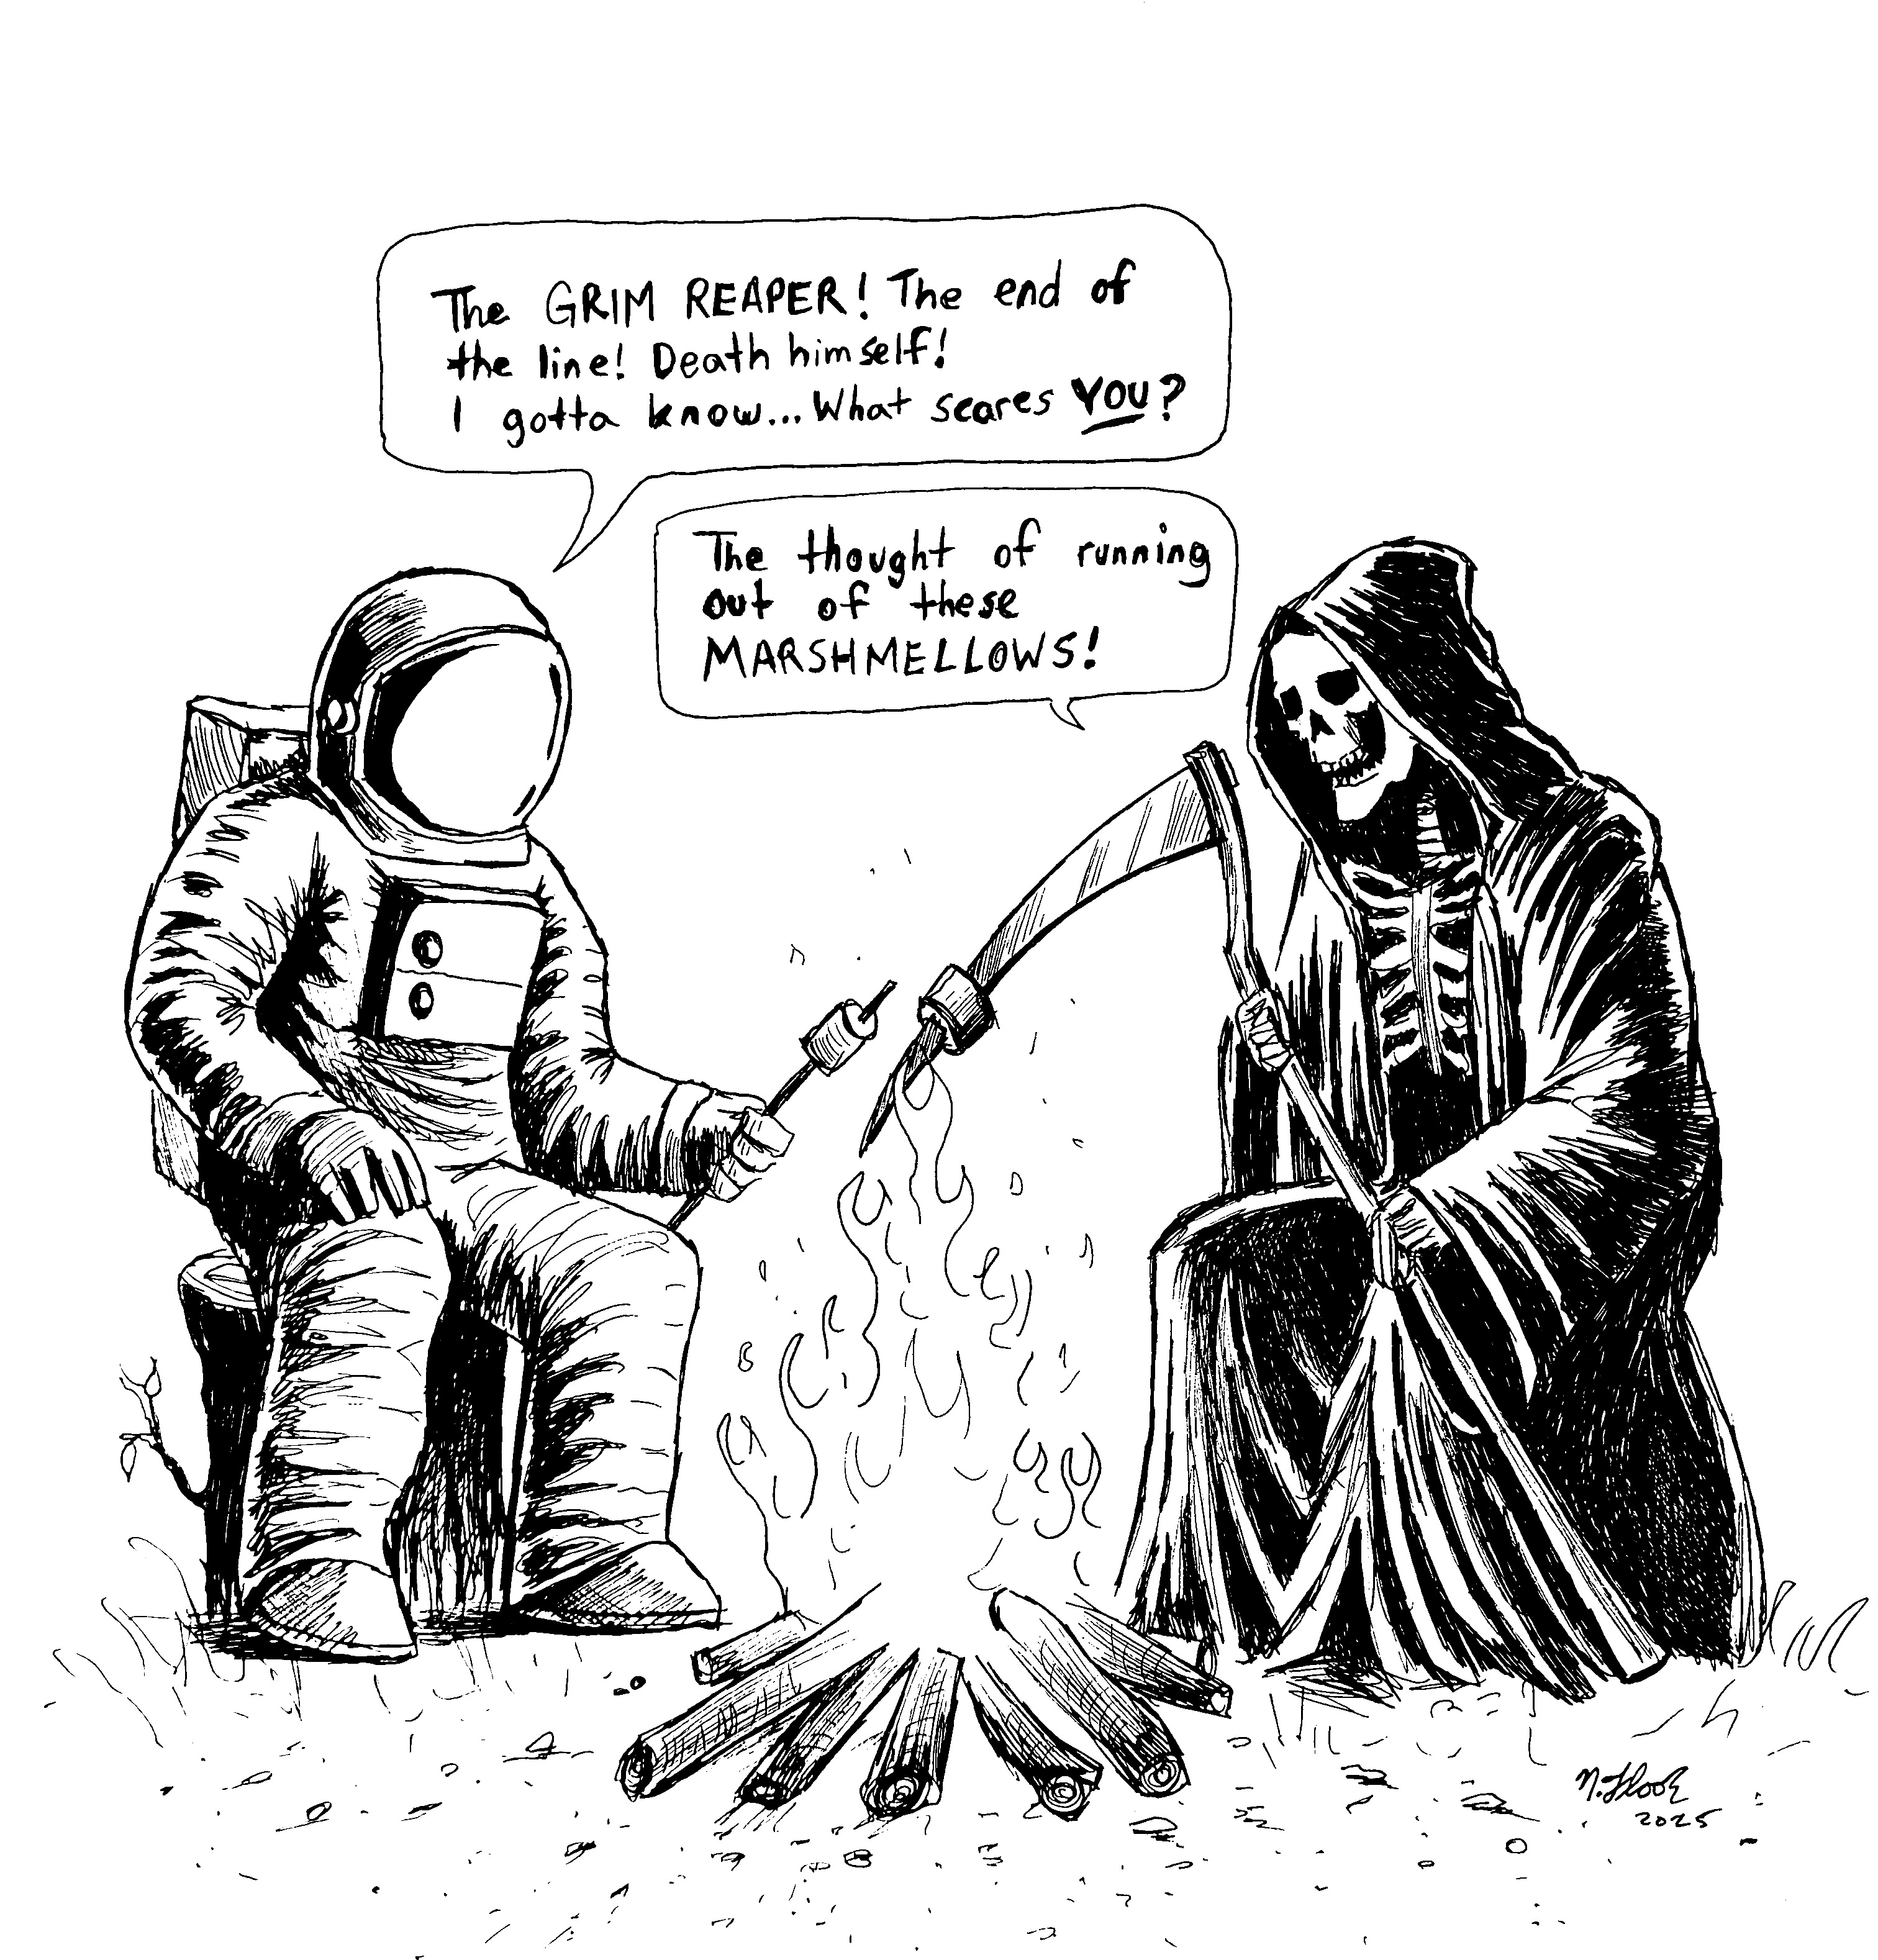
Still on the Decline...
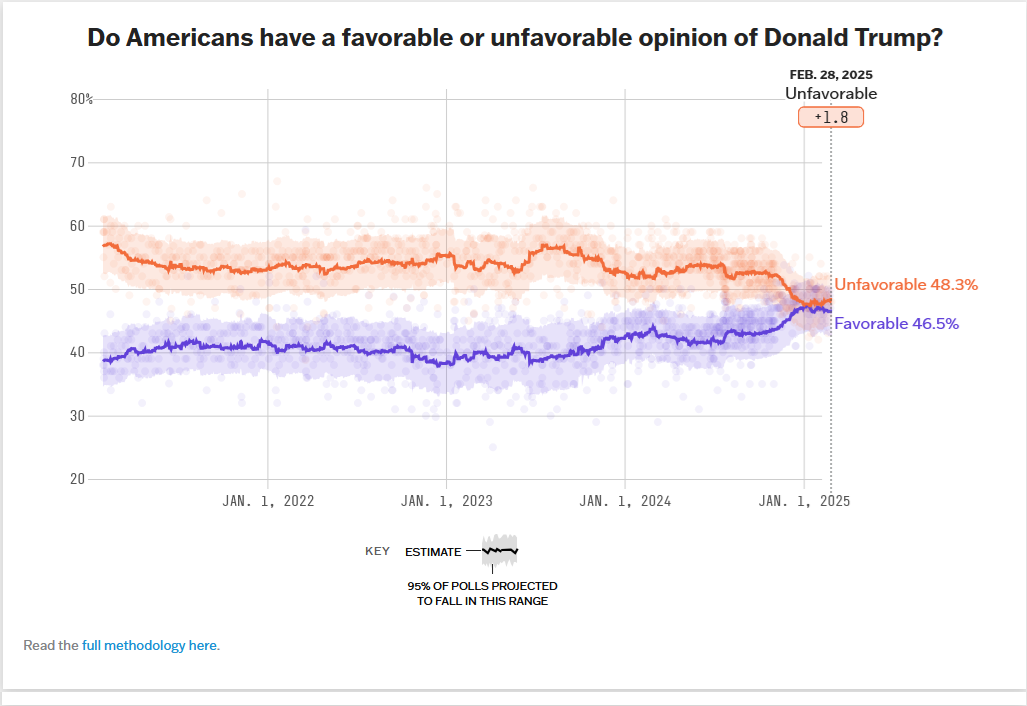
A line graph titled 'Do Americans have a favorable or unfavorable opinion of Donald Trump?' shows two trend lines from 2022 to 2025. The orange line, representing unfavorable opinion, is above the blue line for favorable opinion. At the end of the graph, a data point for February 28, 2025, shows 'Unfavorable 48.3%' and 'Favorable 46.5%', with a '+1.8' indicator for unfavorable. The graph includes a key explaining the 95% confidence interval for poll projections.
0
0
0
0
2025-03-03 09:13:12
See More Related Memes

Loading...
Comments
No comments yet. Be the first to comment!