The 2022 Road Glide: A case of timing gone wrong
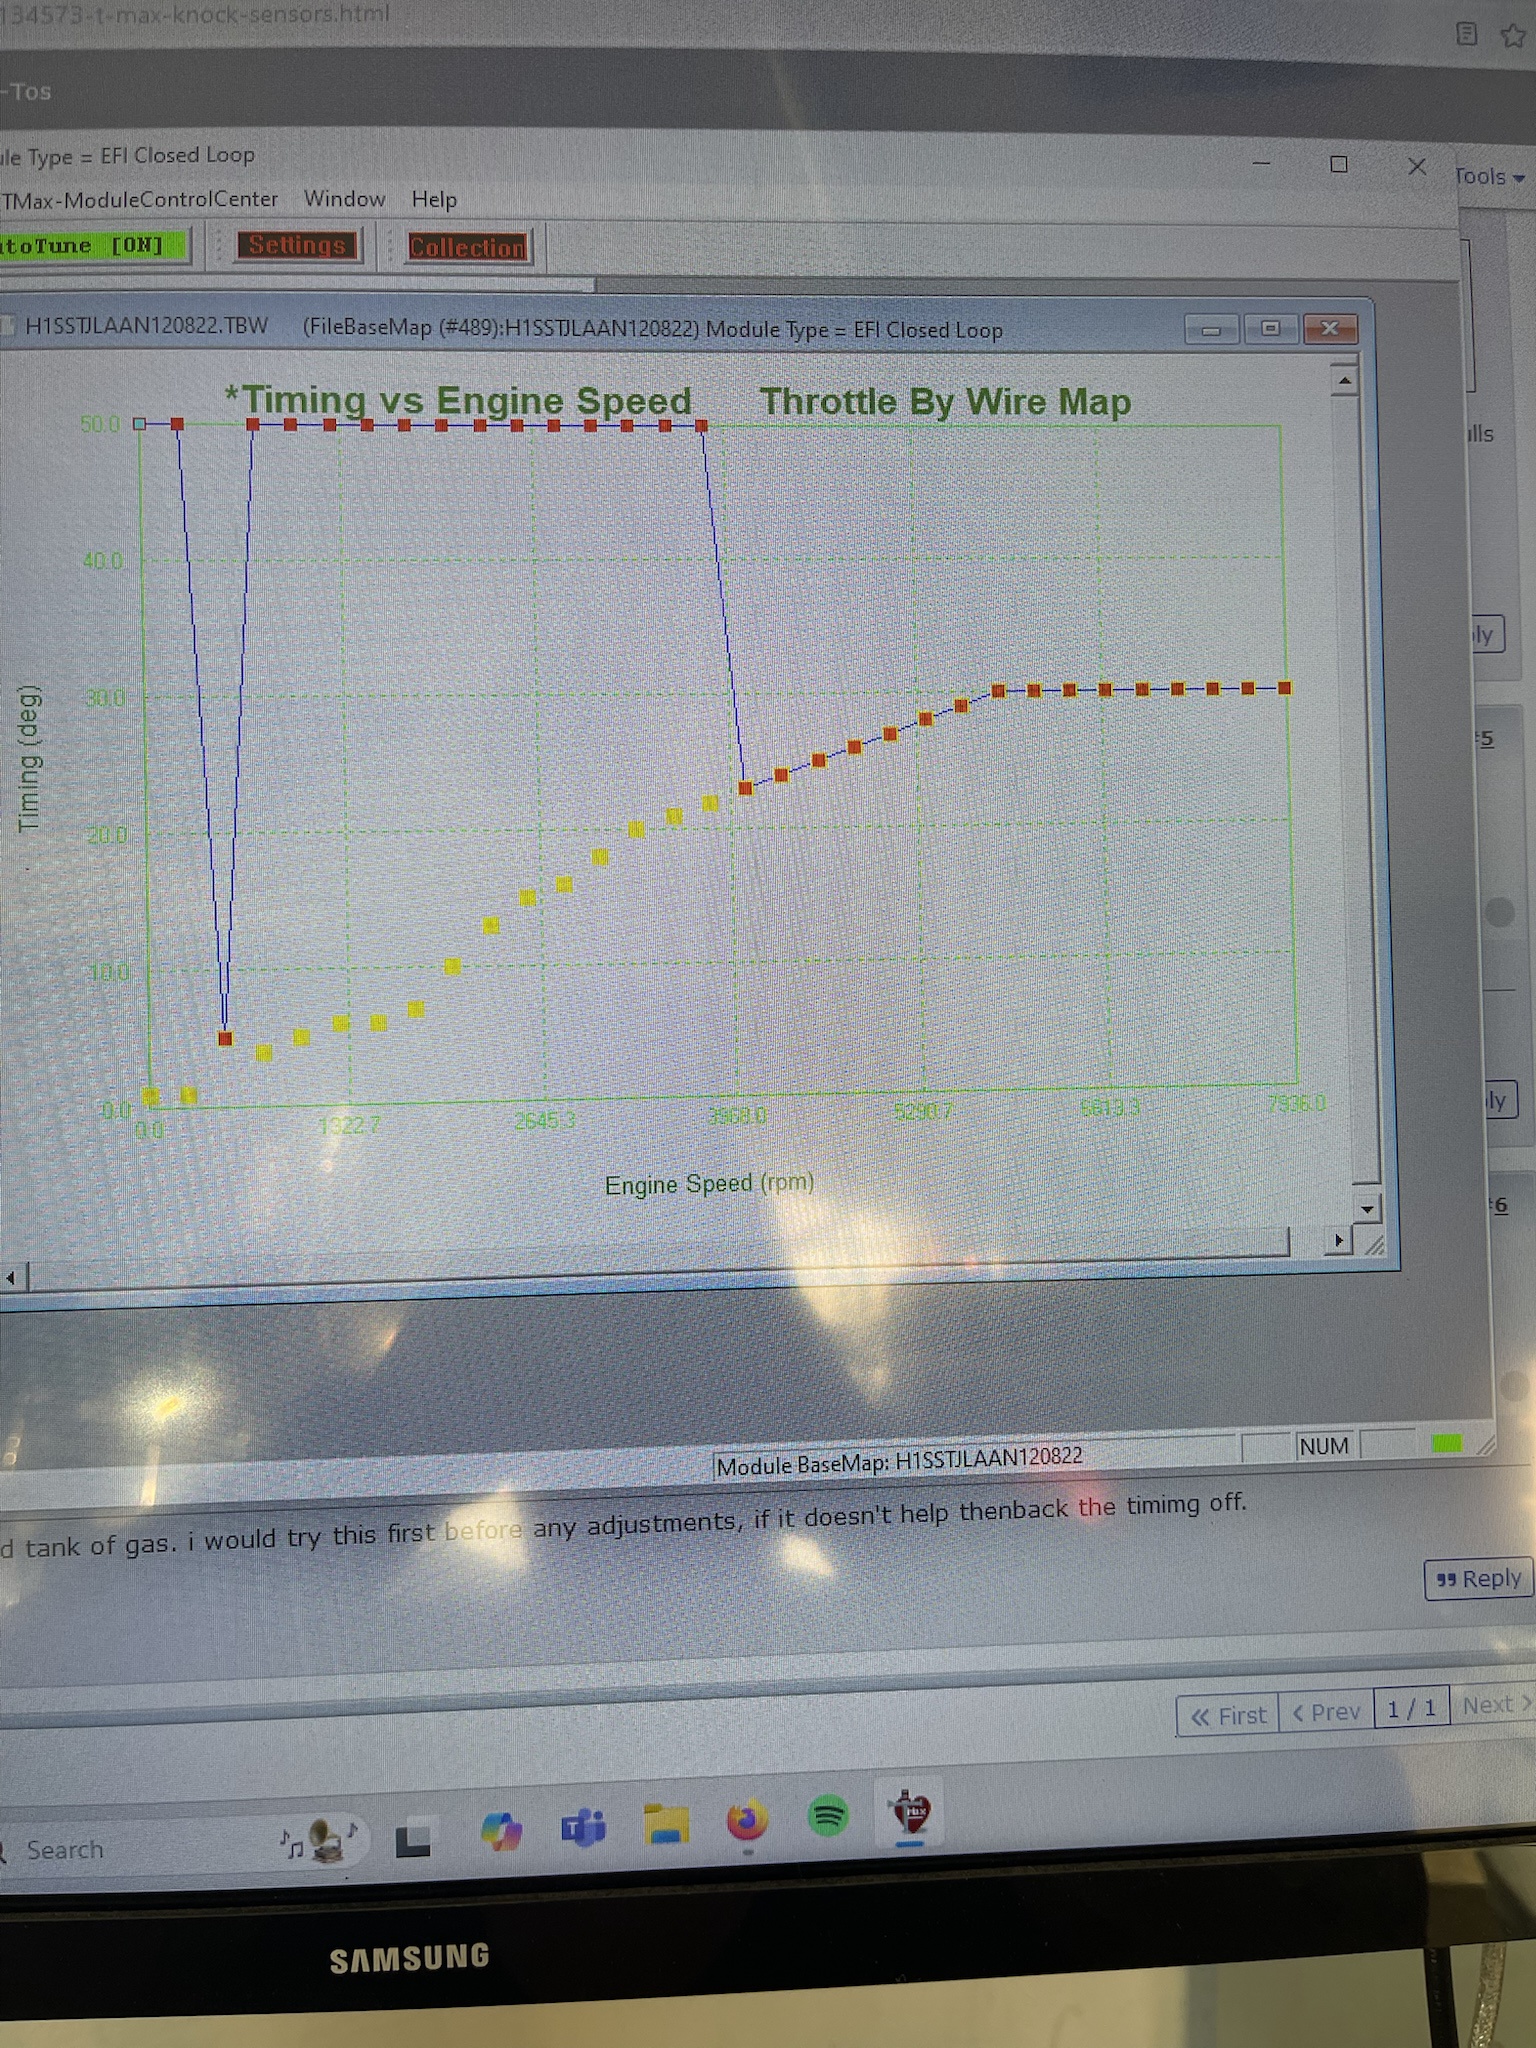
A screenshot of a computer monitor displaying a graph titled 'Timing vs Engine Speed' and 'Throttle By Wire Map' from a tuning software interface. The graph shows engine timing (y-axis) versus engine speed (x-axis) in rpm, with two data series: one (blue) starting at 0° and sharply rising to 50° at low rpm, then dropping to 0° at around 3600 rpm, and another (yellow) rising gradually from 0° to 30° across the rpm range. The overlaid text at the bottom reads 'i would try this first before any adjustments, if it doesn't help then back the timing off.'
0
0
0
0
2025-03-05 18:57:20
See More Related Memes
Loading...
Comments
No comments yet. Be the first to comment!