Oh my goodness!
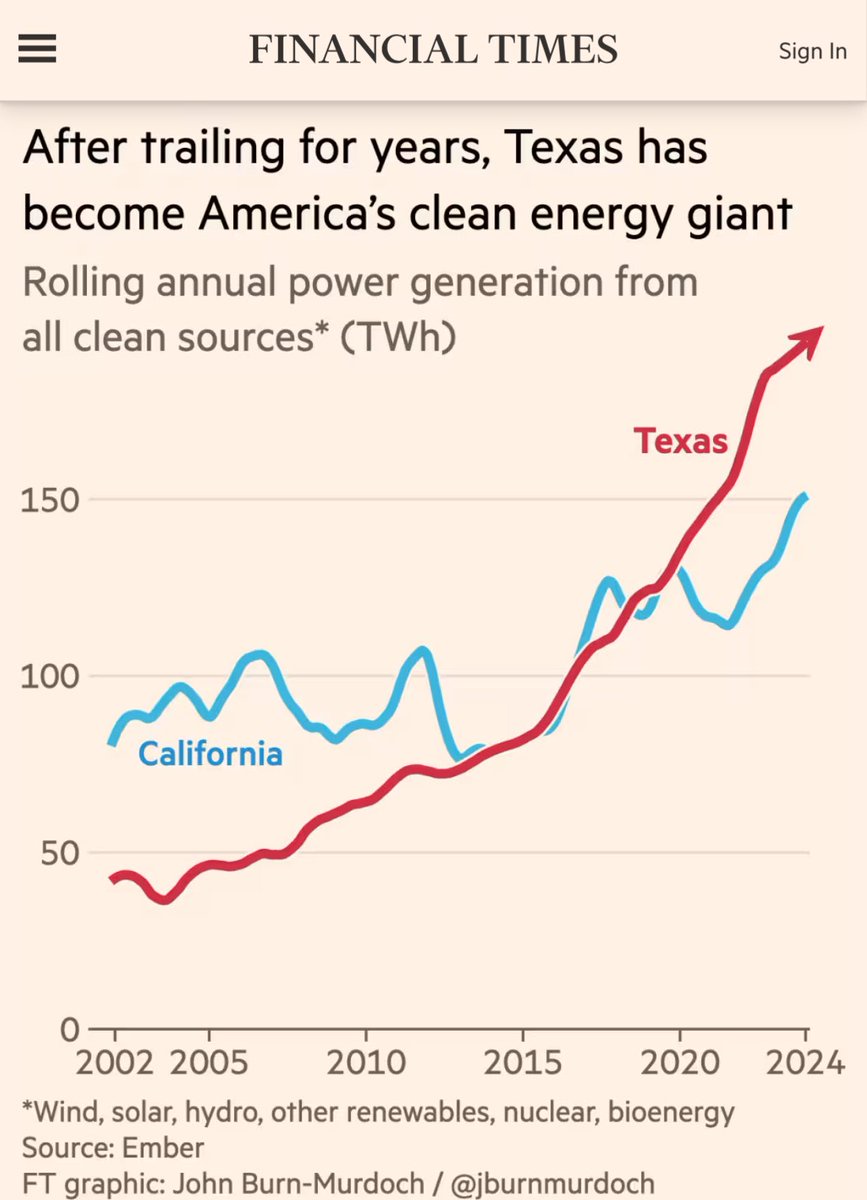
A Financial Times graphic shows a line chart comparing rolling annual clean energy generation (in TWh) for Texas and California from 2002 to 2024. The red line for Texas starts below California's blue line but surges upward, overtaking it around 2020 and continuing to rise sharply, while California's line remains relatively flat. The chart's headline reads 'After trailing for years, Texas has become America's clean energy giant.'
0
0
0
0
2025-06-14 19:40:02
See More Related Memes

Loading...
Comments
No comments yet. Be the first to comment!