The Urgent Call to Action: Sell, Sell, Sell!
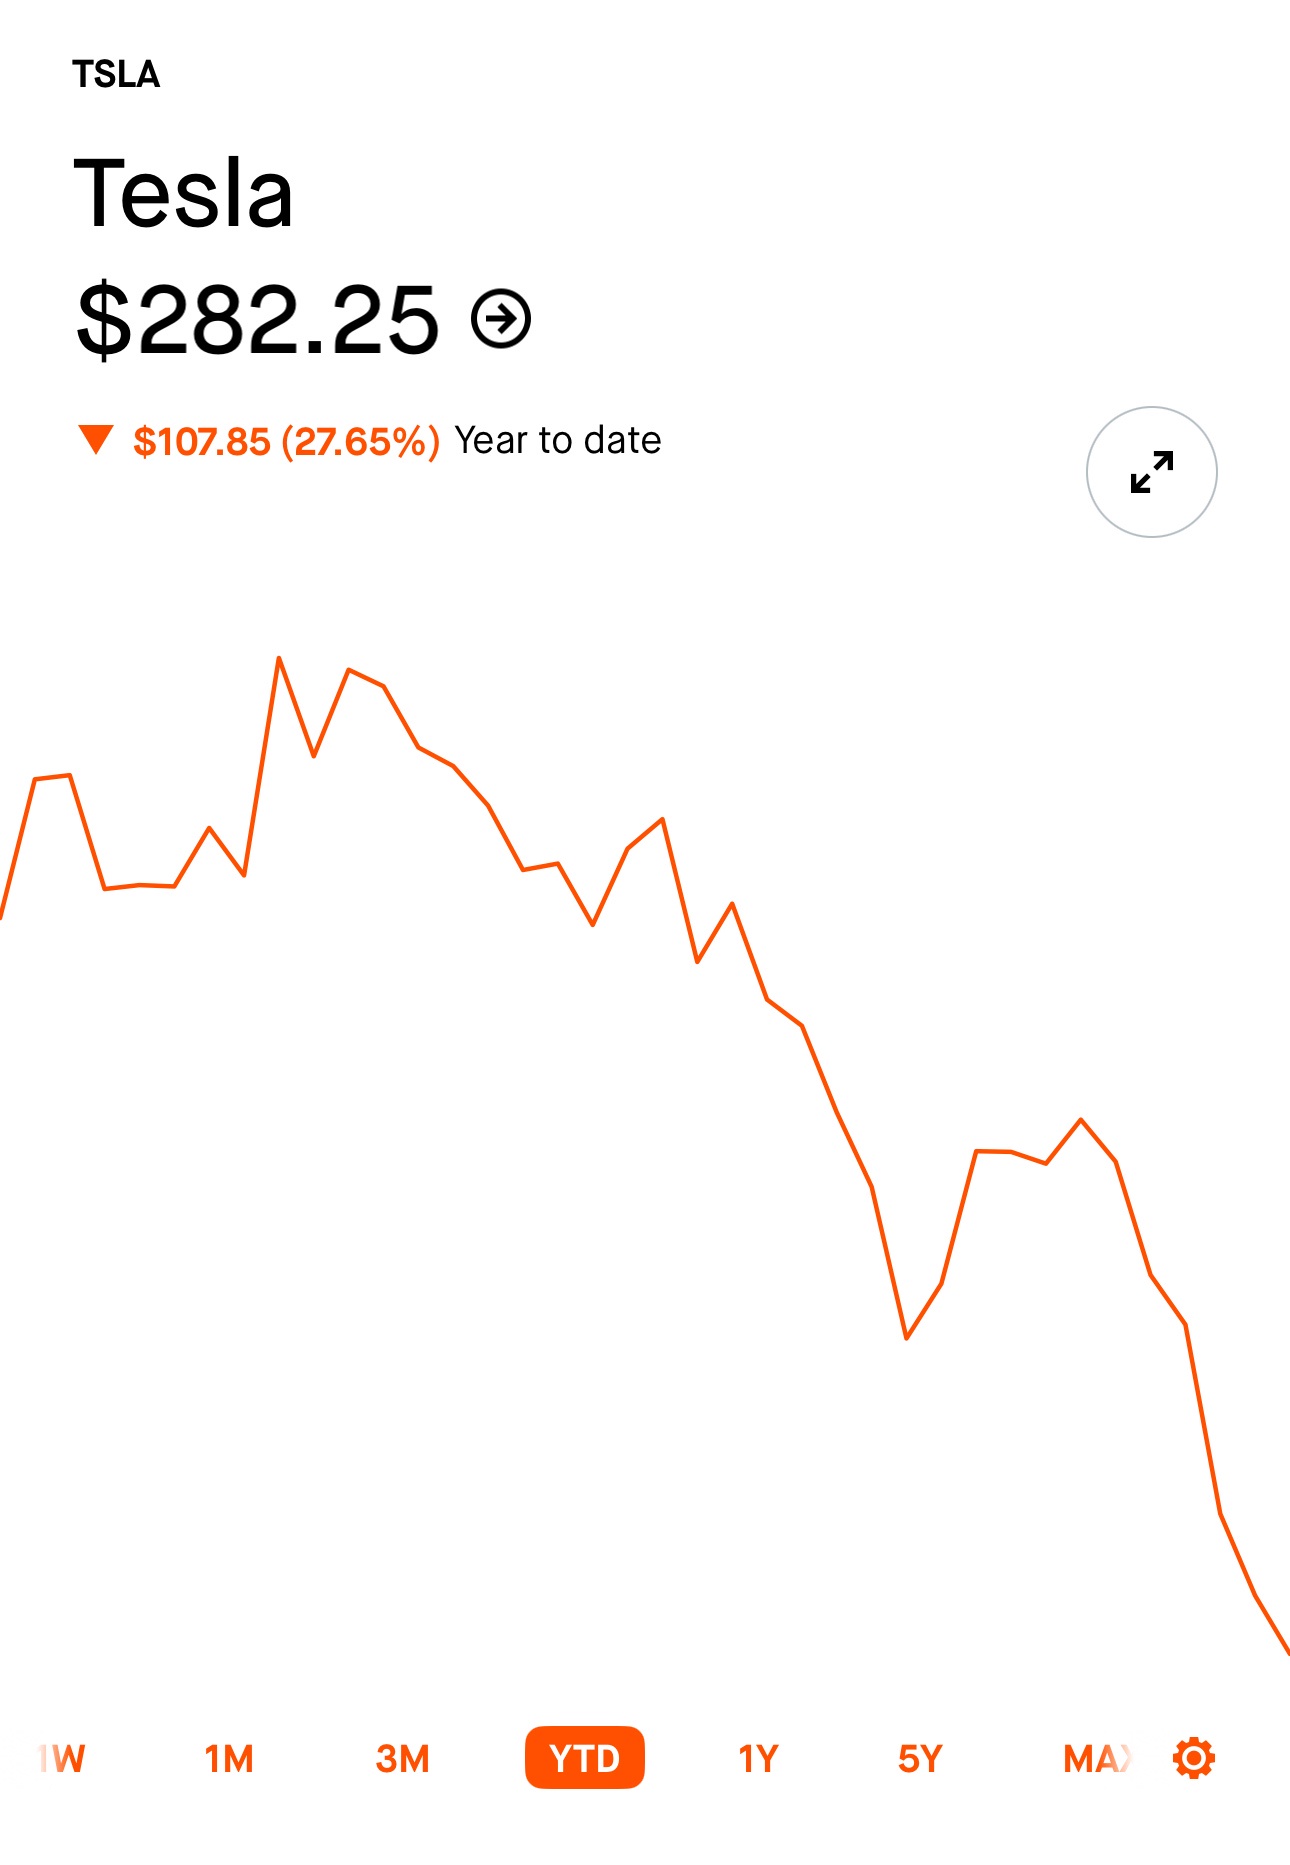
A stock chart for Tesla (TSLA) shows a price of $282.25 with a downward arrow indicating a $107.85 loss (27.65%) year to date. The orange line graph visually depicts a steep decline over the selected YTD (year-to-date) period. The chart interface includes time frame options at the bottom.
0
0
0
0
2025-03-03 18:51:06
See More Related Memes

Loading...
Comments
No comments yet. Be the first to comment!